A grow-light listing can show impressive watts and a large coverage area while leaving the most useful buying question unanswered: how much usable light reaches your actual plants throughout the day? Before comparing prices, define the crop, growth stage, bench geometry and operating schedule. These details turn a broad product claim into a testable lighting brief.
This guide explains the measurements a buyer should request, how to compare coverage maps and where a simple calculation helps. The numbers below are planning examples, not cultivation prescriptions. Crop targets and operating conditions should come from your grower or horticultural adviser.
Start with the crop and the growing space
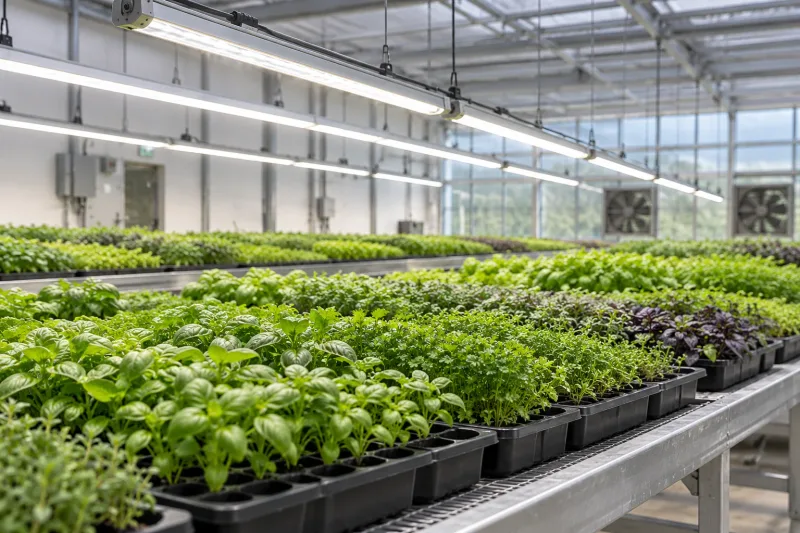
Record the species, stage, canopy area and expected plant height range. A propagation shelf, mature leafy crop and flowering ornamental can need different light and timing decisions. Also record whether the fixture provides all light indoors or supplements daylight in a greenhouse. Calling both applications “indoor growing” hides an important difference in daily exposure.
Measure the usable bench rather than the room floor. Include shelves, irrigation hardware and anything that shades plants. State the closest and farthest canopy positions as plants grow. If light bars must fit below a shelf, that mechanical constraint belongs in the first inquiry, together with access for cleaning and replacement.
Understand PPFD without confusing it with watts
PPFD describes the photon delivery rate over an area; electrical watts describe input power. They answer different questions. Michigan State University’s indoor lighting guide separates light intensity from the duration of exposure when discussing plant lighting.
Ask for a PPFD map at the intended canopy height, with the measurement grid, test area, dimming setting and surrounding conditions identified. A peak value directly under the fixture is only one point. It cannot describe light at the edges or between two bars. Compare minimum, average and maximum values across the area you will actually plant.
Use DLI to connect intensity and operating time
Daily light integral, or DLI, expresses the photon quantity received over a day. For a constant PPFD during a fixed lighting period, the calculation is PPFD × operating hours × 0.0036. Luminus Devices explains the relationship between PPF, PPFD and DLI.
In a greenhouse, a lamp’s contribution does not describe the complete day because daylight changes with season, weather and shading. Ask the grower how daylight is measured and how supplemental operating time will respond. Indoors, timer settings still need review against the crop’s photoperiod requirements. Increasing hours solely to reach a calculated total may create a different growing problem.
Compare the right evidence
| Buying question | Useful evidence | What it does not prove |
|---|---|---|
| Does it cover my bench? | PPFD grid at the proposed height | A single center reading |
| How much light is produced? | Fixture PPF test report | The amount reaching every plant |
| How efficiently does it operate? | Photon efficacy with test conditions | Crop yield or operating cost by itself |
| Will my daily exposure work? | DLI plan including daylight | Suitability for every growth stage |
| Will it fit the growing system? | Drawing, control and environmental details | Compatibility from a photograph |
The DesignLights Consortium horticultural FAQ identifies PPFD heat maps as useful application tools. Request the underlying conditions instead of treating the color gradient as an independent performance guarantee. Product-list qualifications also need confirmation for the exact model if they matter to your procurement process.
A worked example for a small propagation bench
Assume a bench measures 1.2 m by 0.6 m, operates entirely indoors and has a grower-selected planning target of 10 mol/m²/day. Assume the proposed map shows an average PPFD of 180 µmol/m²/s at the planned canopy height, with lamps operating for 16 hours. The calculated lamp contribution is 180 × 16 × 0.0036 = 10.37 mol/m²/day.
That average looks close to the stated target, but suppose the edge reading is only 110. The edge receives approximately 6.34 mol/m²/day under the same assumptions. Raising the timer would also raise the center exposure, so the better next step is to examine fixture spacing, coverage and crop tolerance. This example demonstrates why a suitable average can conceal an unsuitable distribution; it does not establish a recommended recipe.
Check spectrum and controls as a system
Ask for the spectral distribution and a clear explanation of any independently controlled channels. A label such as “full spectrum” leaves too much open for a purchase decision. Your adviser should connect the spectrum to the crop objective. For visual inspection, also consider how workers will recognize leaf color, pests and irrigation problems under the proposed lighting.
Confirm whether dimming changes only intensity or also the channel balance. Request the control method, schedule behavior, restart state and documentation for the exact fixture. If multiple benches share a controller, define whether they need separate zones. Keep those decisions with the approved crop and lighting schedule so later adjustments remain traceable.
Send a sample and project checklist
Before ordering, request a drawing showing suspension points and clearance; a PPFD map at your height and area; the spectrum and fixture PPF data; input and control requirements; environmental limits; and cleaning guidance. Agree what the sample will demonstrate and who will assess it. In the trial, log canopy height, output setting, measured grid readings and operating hours.
For a custom light-source discussion, browse LED and COB light sources and submit your bench drawing and crop brief through light source solutions. Confirm the spectrum and canopy measurements for the proposed assembly before selecting a module. The companion guides to LED driver selection and heat sinks and optics help complete the component discussion.
Frequently asked questions
Can I compare grow lights by wattage alone?
No. Wattage helps describe electrical input, but useful canopy delivery depends on output, distribution, height and placement. Compare measurements under the same application conditions before using watts to estimate the supply load.
Is a higher PPFD always better?
No. The desired intensity depends on crop, stage and other growing conditions. Request a target from your grower, then check whether the layout delivers it across the bench without unacceptable peaks or shaded edges.
Does a PPFD map guarantee crop results?
No. It describes a lighting arrangement under stated conditions. Crop outcomes also depend on temperature, nutrition, water, plant health and management. Use the map to specify and verify light delivery, then evaluate growing performance in your own trial.